
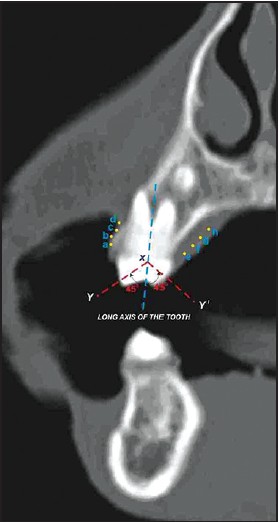
Figure 3: Coronal section view in computed tomography with buccal and palatal points marked at different levels for soft-tissue thickness
| Close | |
|
|
|
|
Figure 3: Coronal section view in computed tomography with buccal and palatal points marked at different levels for soft-tissue thickness
|
|