
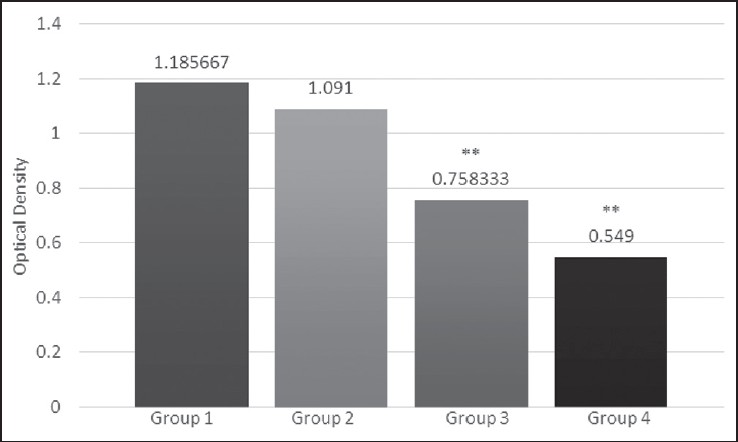
Figure 1: Optical density representing the amount of viable Streptococcus mutans in all the treatment groups (**P < 0.01)
| Close | |
|
|
|
|
Figure 1: Optical density representing the amount of viable Streptococcus mutans in all the treatment groups (**P < 0.01)
|
|