- Institution: Stanford Univ Med Ctr Lane Med Lib/Periodical Dept/Rm L109
- Sign In as Member / Individual
Cardiac Glycosides as Novel Cancer Therapeutic Agents
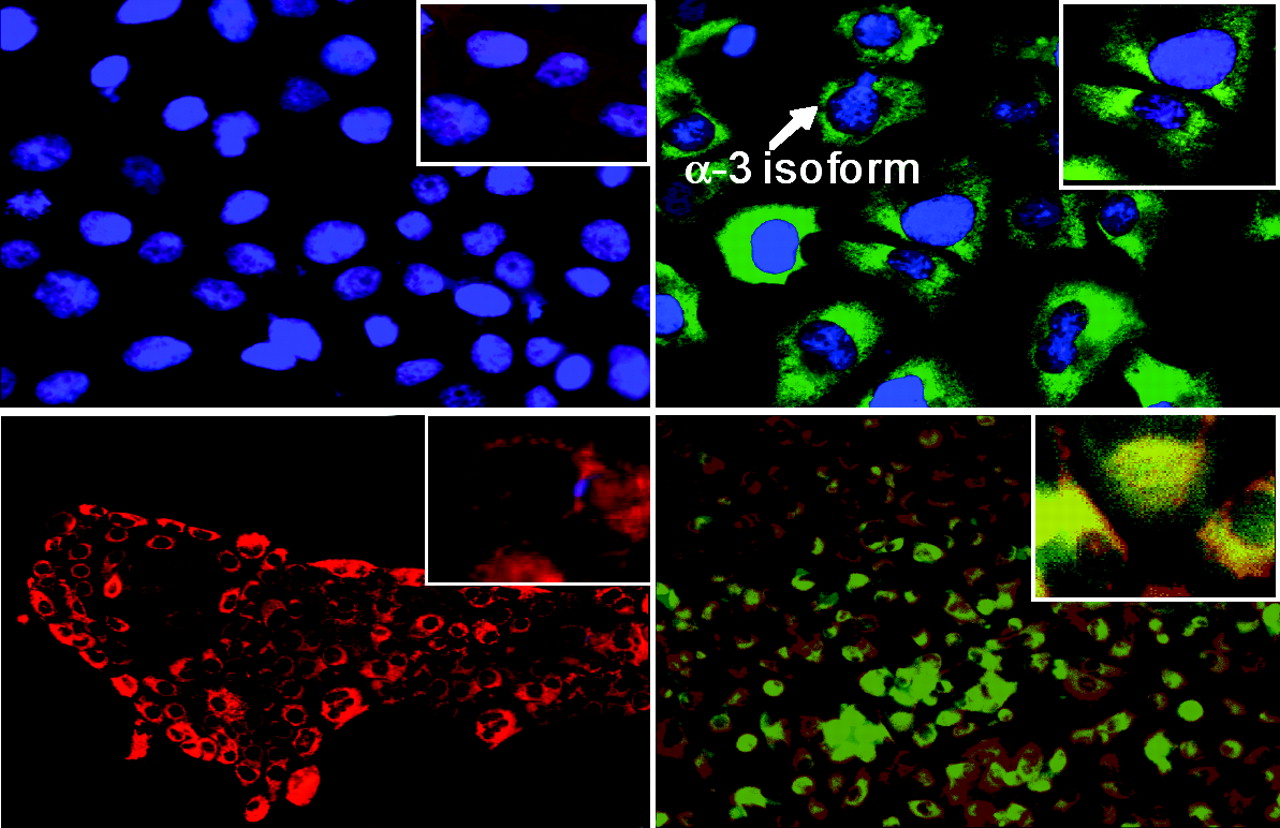
Relationship of expression of Na+,K+-ATPase α 3 subunit and binding of oleandrin to human pancreatic cancer cell membranes. Cells were stained using a mitochondrial dye, Mitotracker, (red color) and a nuclear Herscht dye (blue). Top row: Cells were also exposed to an antibody to the α 3 subunit of Na+,K+-ATPase (green color). Bottom row: Cells were incubated with a fluorescent analog of oleandrin (green color). The presence of green staining (top row) indicates the relative presence of the α 3 subunit which is more prevalent in the PANC-1 than the BXPC3 cells. There is a corresponding uptake of oleandrin (bottom row) only in those cells (PANC-1) that express the α 3 subunit.

