Strategizing the Clone Wars: Pharmacological Control of Cellular Sensitivity to Radiation
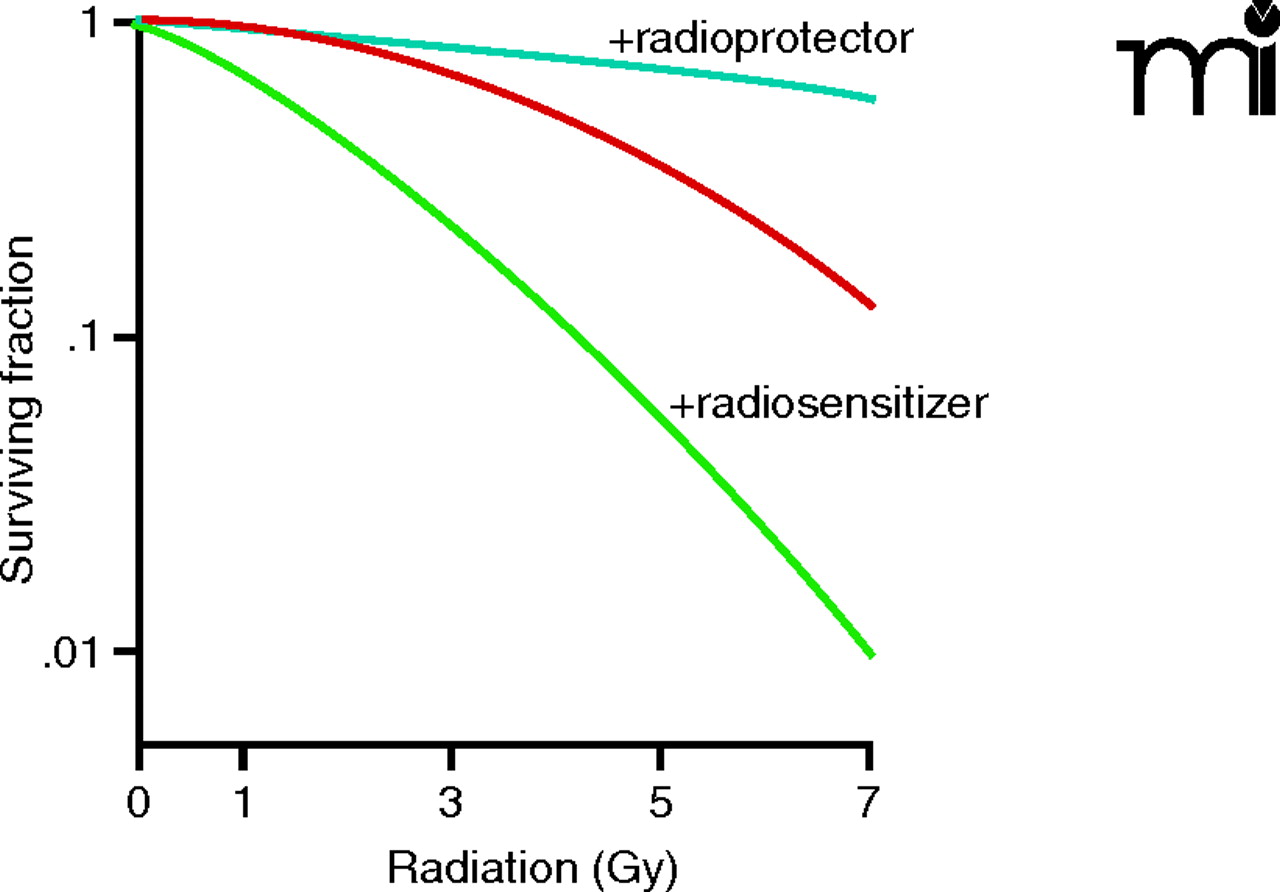
Figure 2
The radiation biologist’s approach to the dose response curve. Although most dose response curves are plotted on a log-linear graph, the gold standard radiobiology assay is typically represented, as shown here, on a linear-log graph, with meaningful radiation responses occurring over a range of 1 to 2 log units. Use of an agent that sensitizes a tumor to radiation results in a leftward shift (green) of the baseline radiation curve (red), whereas agents that protect cells from radiation shift the curve in the opposite direction (light blue). This analysis is modeled using a linear-quadratic formulation as Y=e−(AX+BX2).

