


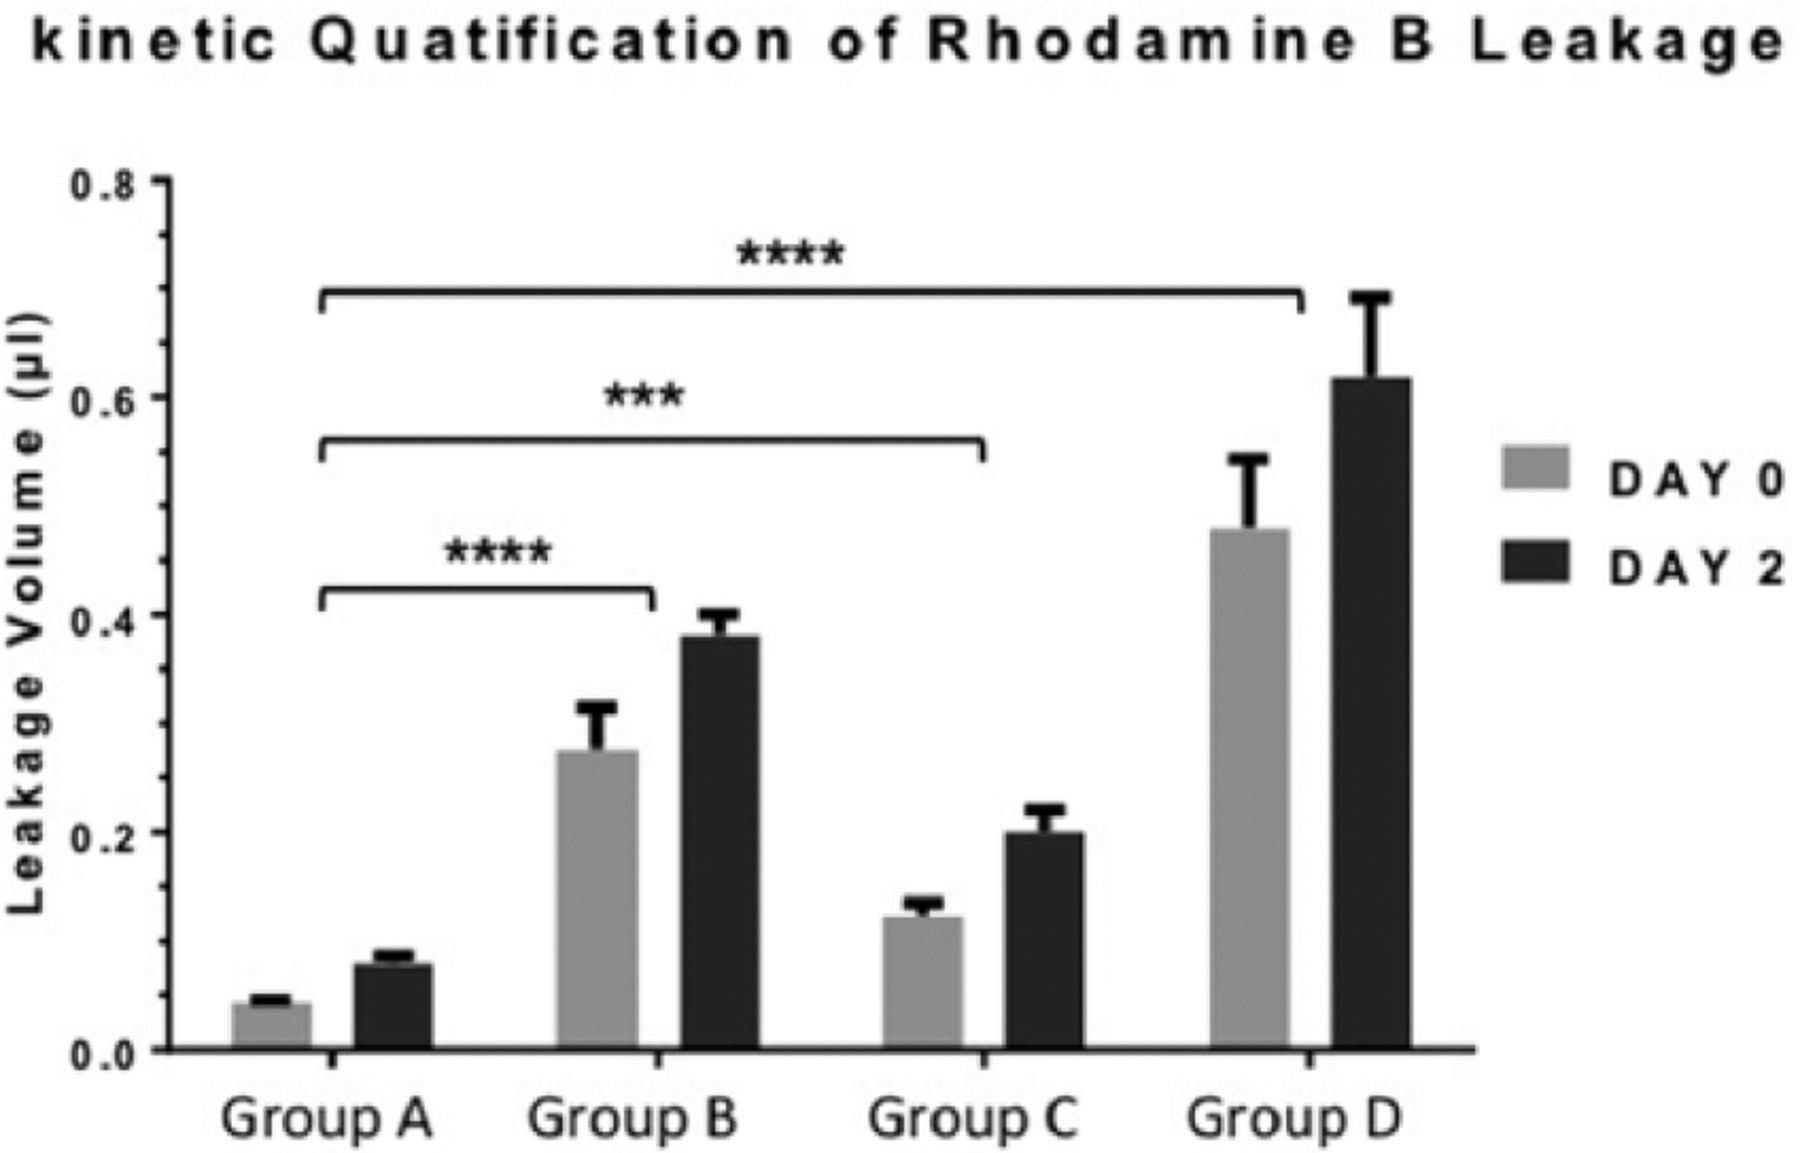
Figure 5.
At D0 and D1, the leakage volume of each system is shown. According to the Prism convention of significance, results were considered highly significant: ***P ≤ 0.001; ****P ≤ 0.0001.
(Downloading may take up to 30 seconds. If the slide opens in your browser, select File -> Save As to save it.)
Click on image to view larger version.
At D0 and D1, the leakage volume of each system is shown. According to the Prism convention of significance, results were considered highly significant: ***P ≤ 0.001; ****P ≤ 0.0001.
 CiteULike
 Connotea
 Delicious
 Digg
Digg Facebook
 Google+
 LinkedIn
 Mendeley
 Reddit
 StumbleUpon
 Twitter

