


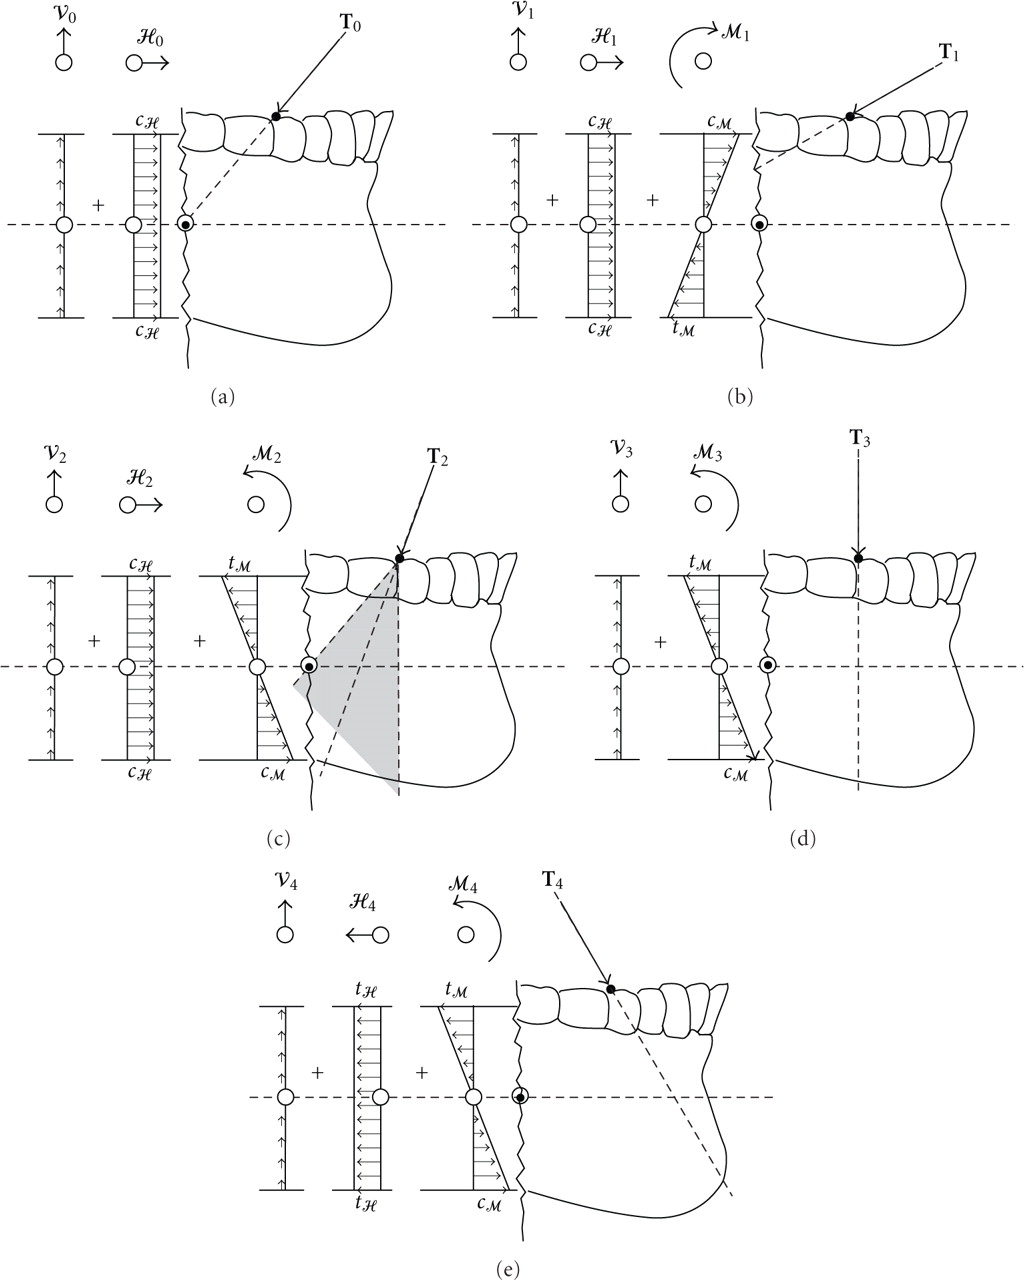
Figure 5:
The tension, t, and compression, c, bone-stress distributions (not to scale) equivalent to v, ℋ, and ℳ (presented in Figure 4) for (a) T0; (b) T1; (c) T2; (d) T3; (e) T4. The shaded area in (c) indicates that the LOA of T2 falls between the LOAs of T0 and T3. (These figures are only relevant to the intact mandible.)