


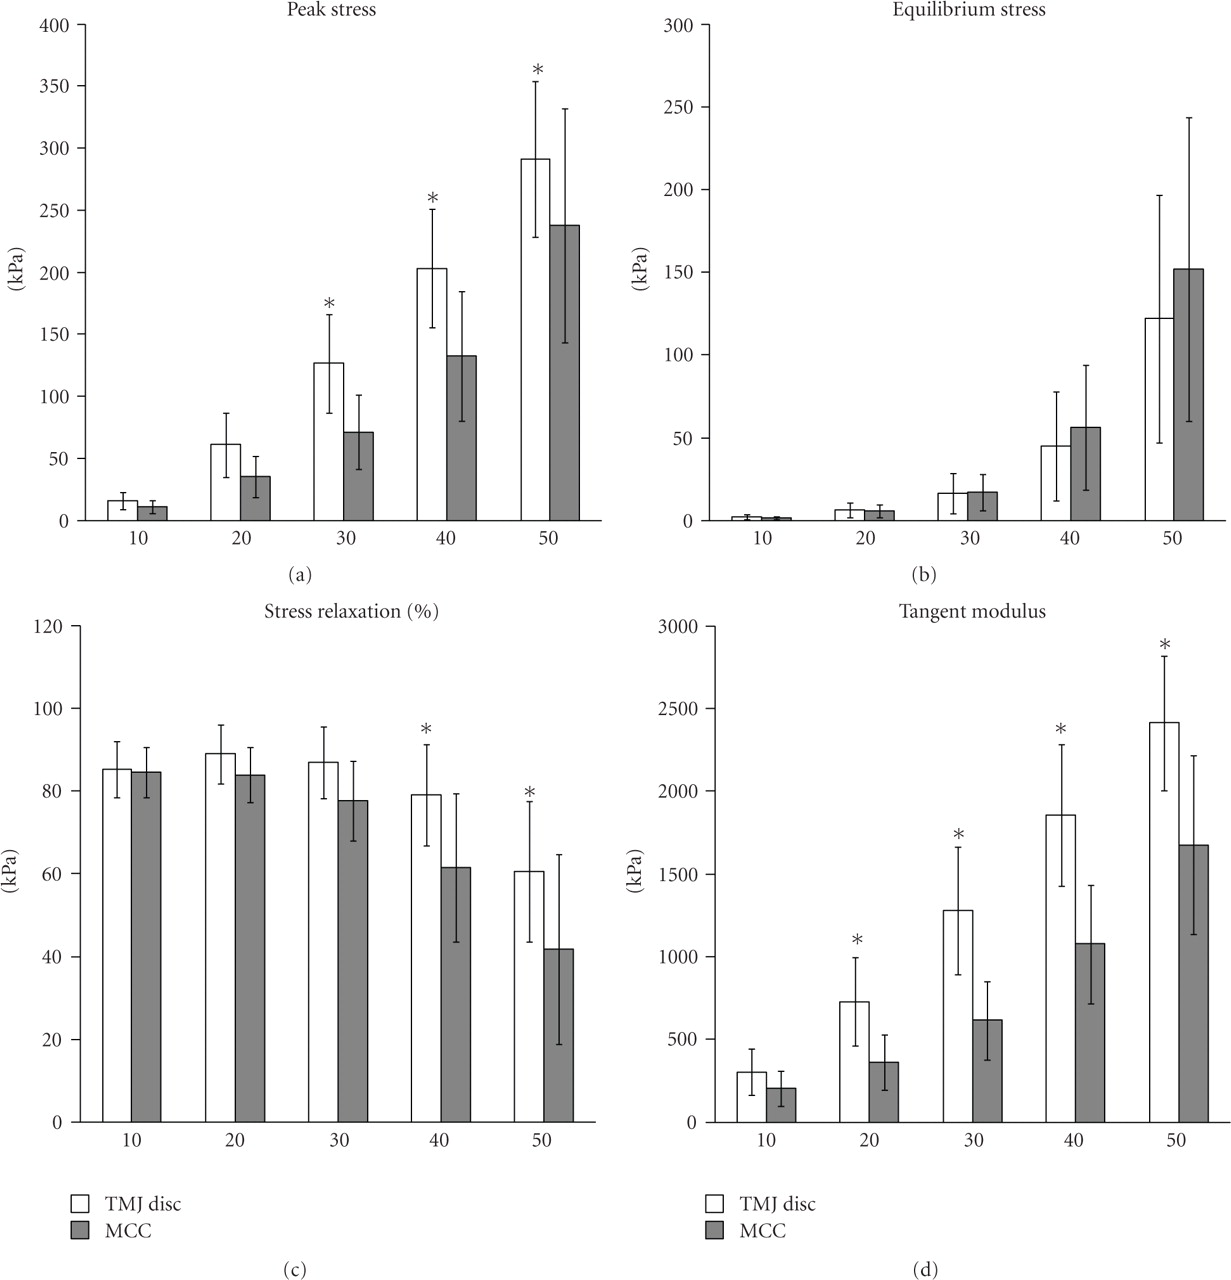
Figure 2:
Simple compression analysis of the TMJ disc ( goats ×
  regions) and MCC (
 goats ×
  regions) at 10%, 20%, 30%, 40%, and 50% strain. (a) Peak stress (b) Equilibrium stress (c) Percent stress relaxation (d).
Tangent modulus. The symbol (∗) indicates significance (
regions) at 10%, 20%, 30%, 40%, and 50% strain. (a) Peak stress (b) Equilibrium stress (c) Percent stress relaxation (d).
Tangent modulus. The symbol (∗) indicates significance ( ) between the TMJ disc and MCC at each strain step. Error bars indicate S.D.