


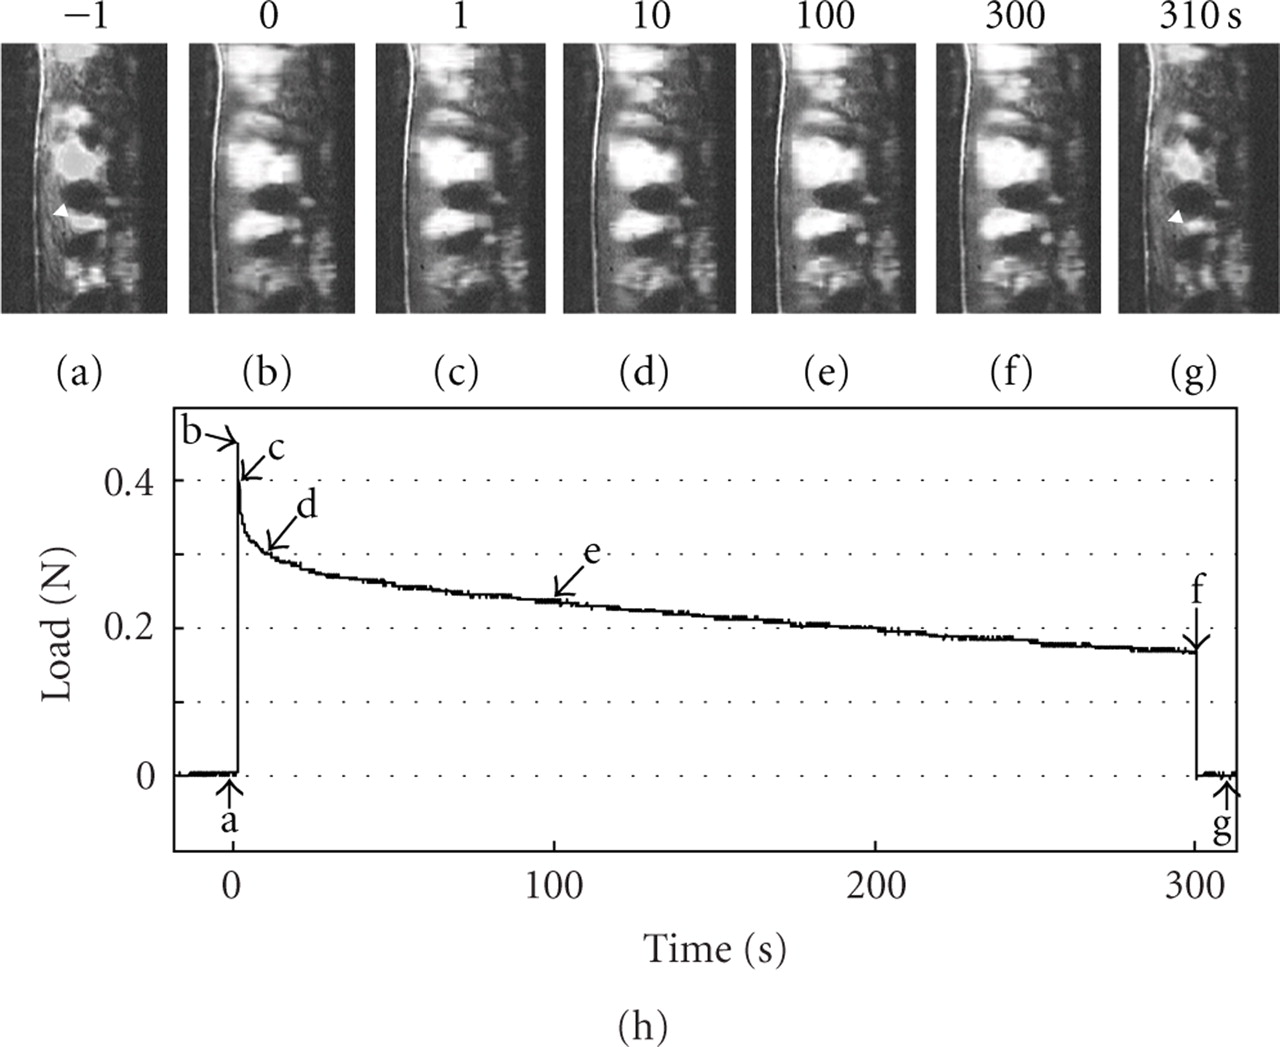
Figure 13
Simultaneous recording of video microscopic images and load values during stress-relaxation under a constant deformation of 75 μm. The video images (a)–(g) correspond to each point (a)–(g) on the load-relaxation curve (h).