


Figure 11
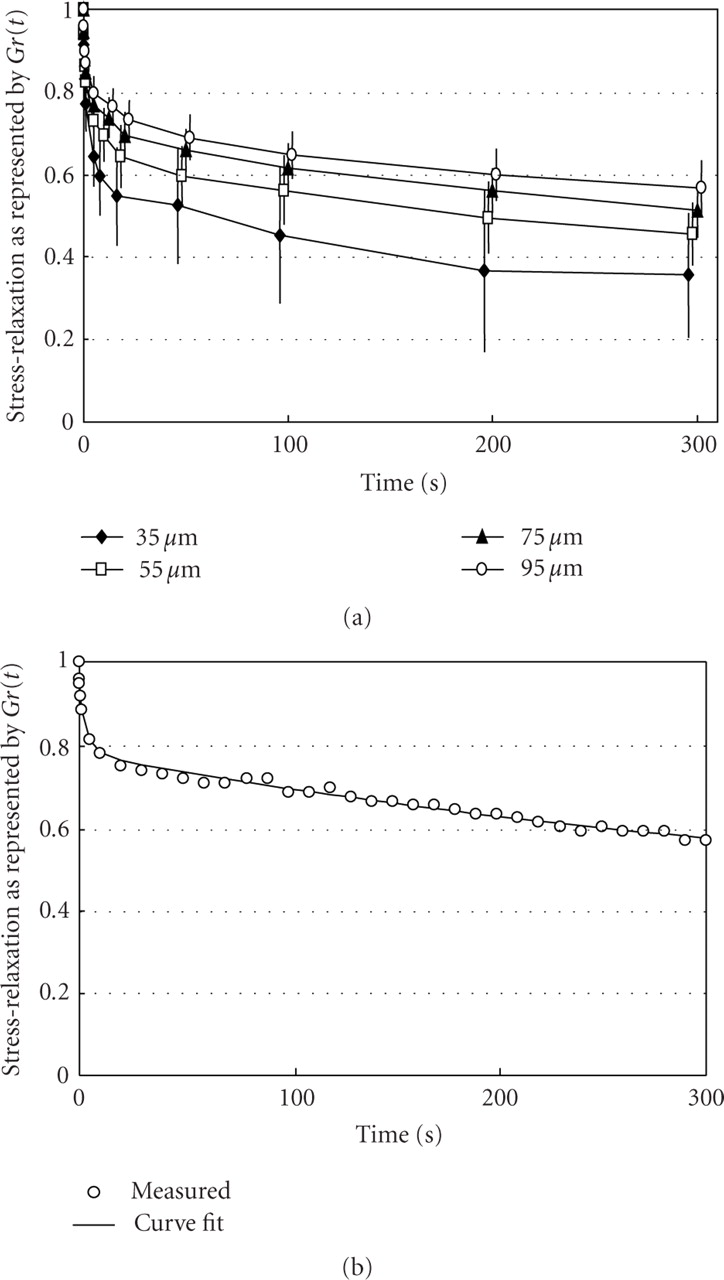
(a) Stress-relaxation as represented by  for rabbit periodontal ligament. Each point and bars represent mean
± 1 SD. (b) Typical example of exponential curve fitting.
Measured values (open circles) are well expressed by an equation:
for rabbit periodontal ligament. Each point and bars represent mean
± 1 SD. (b) Typical example of exponential curve fitting.
Measured values (open circles) are well expressed by an equation:
 ,
reproduced from Komatsu et al. (2007) [62], by permission.
,
reproduced from Komatsu et al. (2007) [62], by permission.